

CMAT2-R-Omics_Fig1.jpg
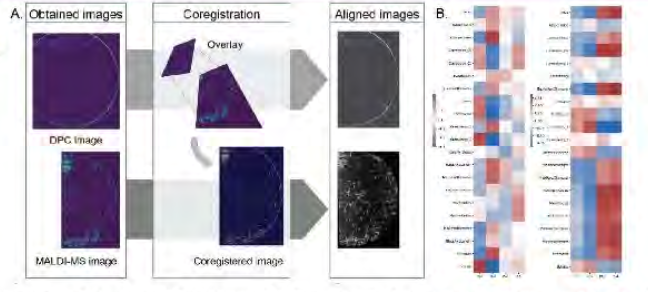
(A) Coregistration of label-free DPC image and MALDI image. (B) Correlation map showing association of MSCs morphology with PC values based on lipid peaks in simulated and unsimulated MSCs.
Credit:
CMaT
Related center:
(A) Coregistration of label-free DPC image and MALDI image. (B) Correlation map showing association of MSCs morphology with PC values based on lipid peaks in simulated and unsimulated MSCs.