

PATHS-UP1-R-Barcode_JT.jpg
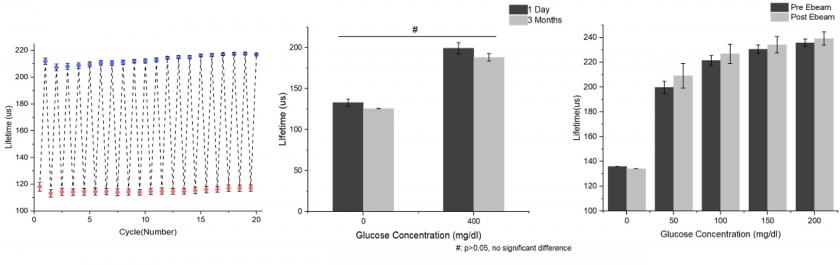
Figure. (a) Operational and storage stability assessment of the glucose responsive samples within the barcode hydrogel sensor. Each point represents an average of three samples. Error bars represent 95% confidence intervals. (b) Response from barcode with glucose responsive compartments before and after E-beam sterilization.
Credit:
PATHS-UP
Related content: